Data Visualisations
This page showcases some of sentiment analysis results produced by the RUB Corpus and Code.
Introduction
The following is some general information about the RUB Corpus and Code.
The RUB Corpus is a collection of 71,515 Russian language texts published between 01 January 2006 to 31 December 2016.
RUB is an acronym of the countries where the texts originated from: Russia, Ukraine, and Belarus.
A text is sentences spoken by an incumbent president, prime minister, or minister of foreign affairs from a single speech, interview, or official press release on a particular date.
The sources for these texts are online, official government archives.
The texts were gathered as part of a PhD dissertation analysing policymakers’ sentiments concerning bilateral relationships (Russian policymakers’ opinion towards China, for example) over time.
The RUB Code was used to carry out this sentiment analysis of Russian, Ukrainian, and Belarusian policymakers’ official texts.
The RUB Corpus and Code can be downloaded from the Corpus page and Code page.
RUB Sentiment Analysis
These are some of the sentiment analysis results visualised using R software (R Core Team 2020).
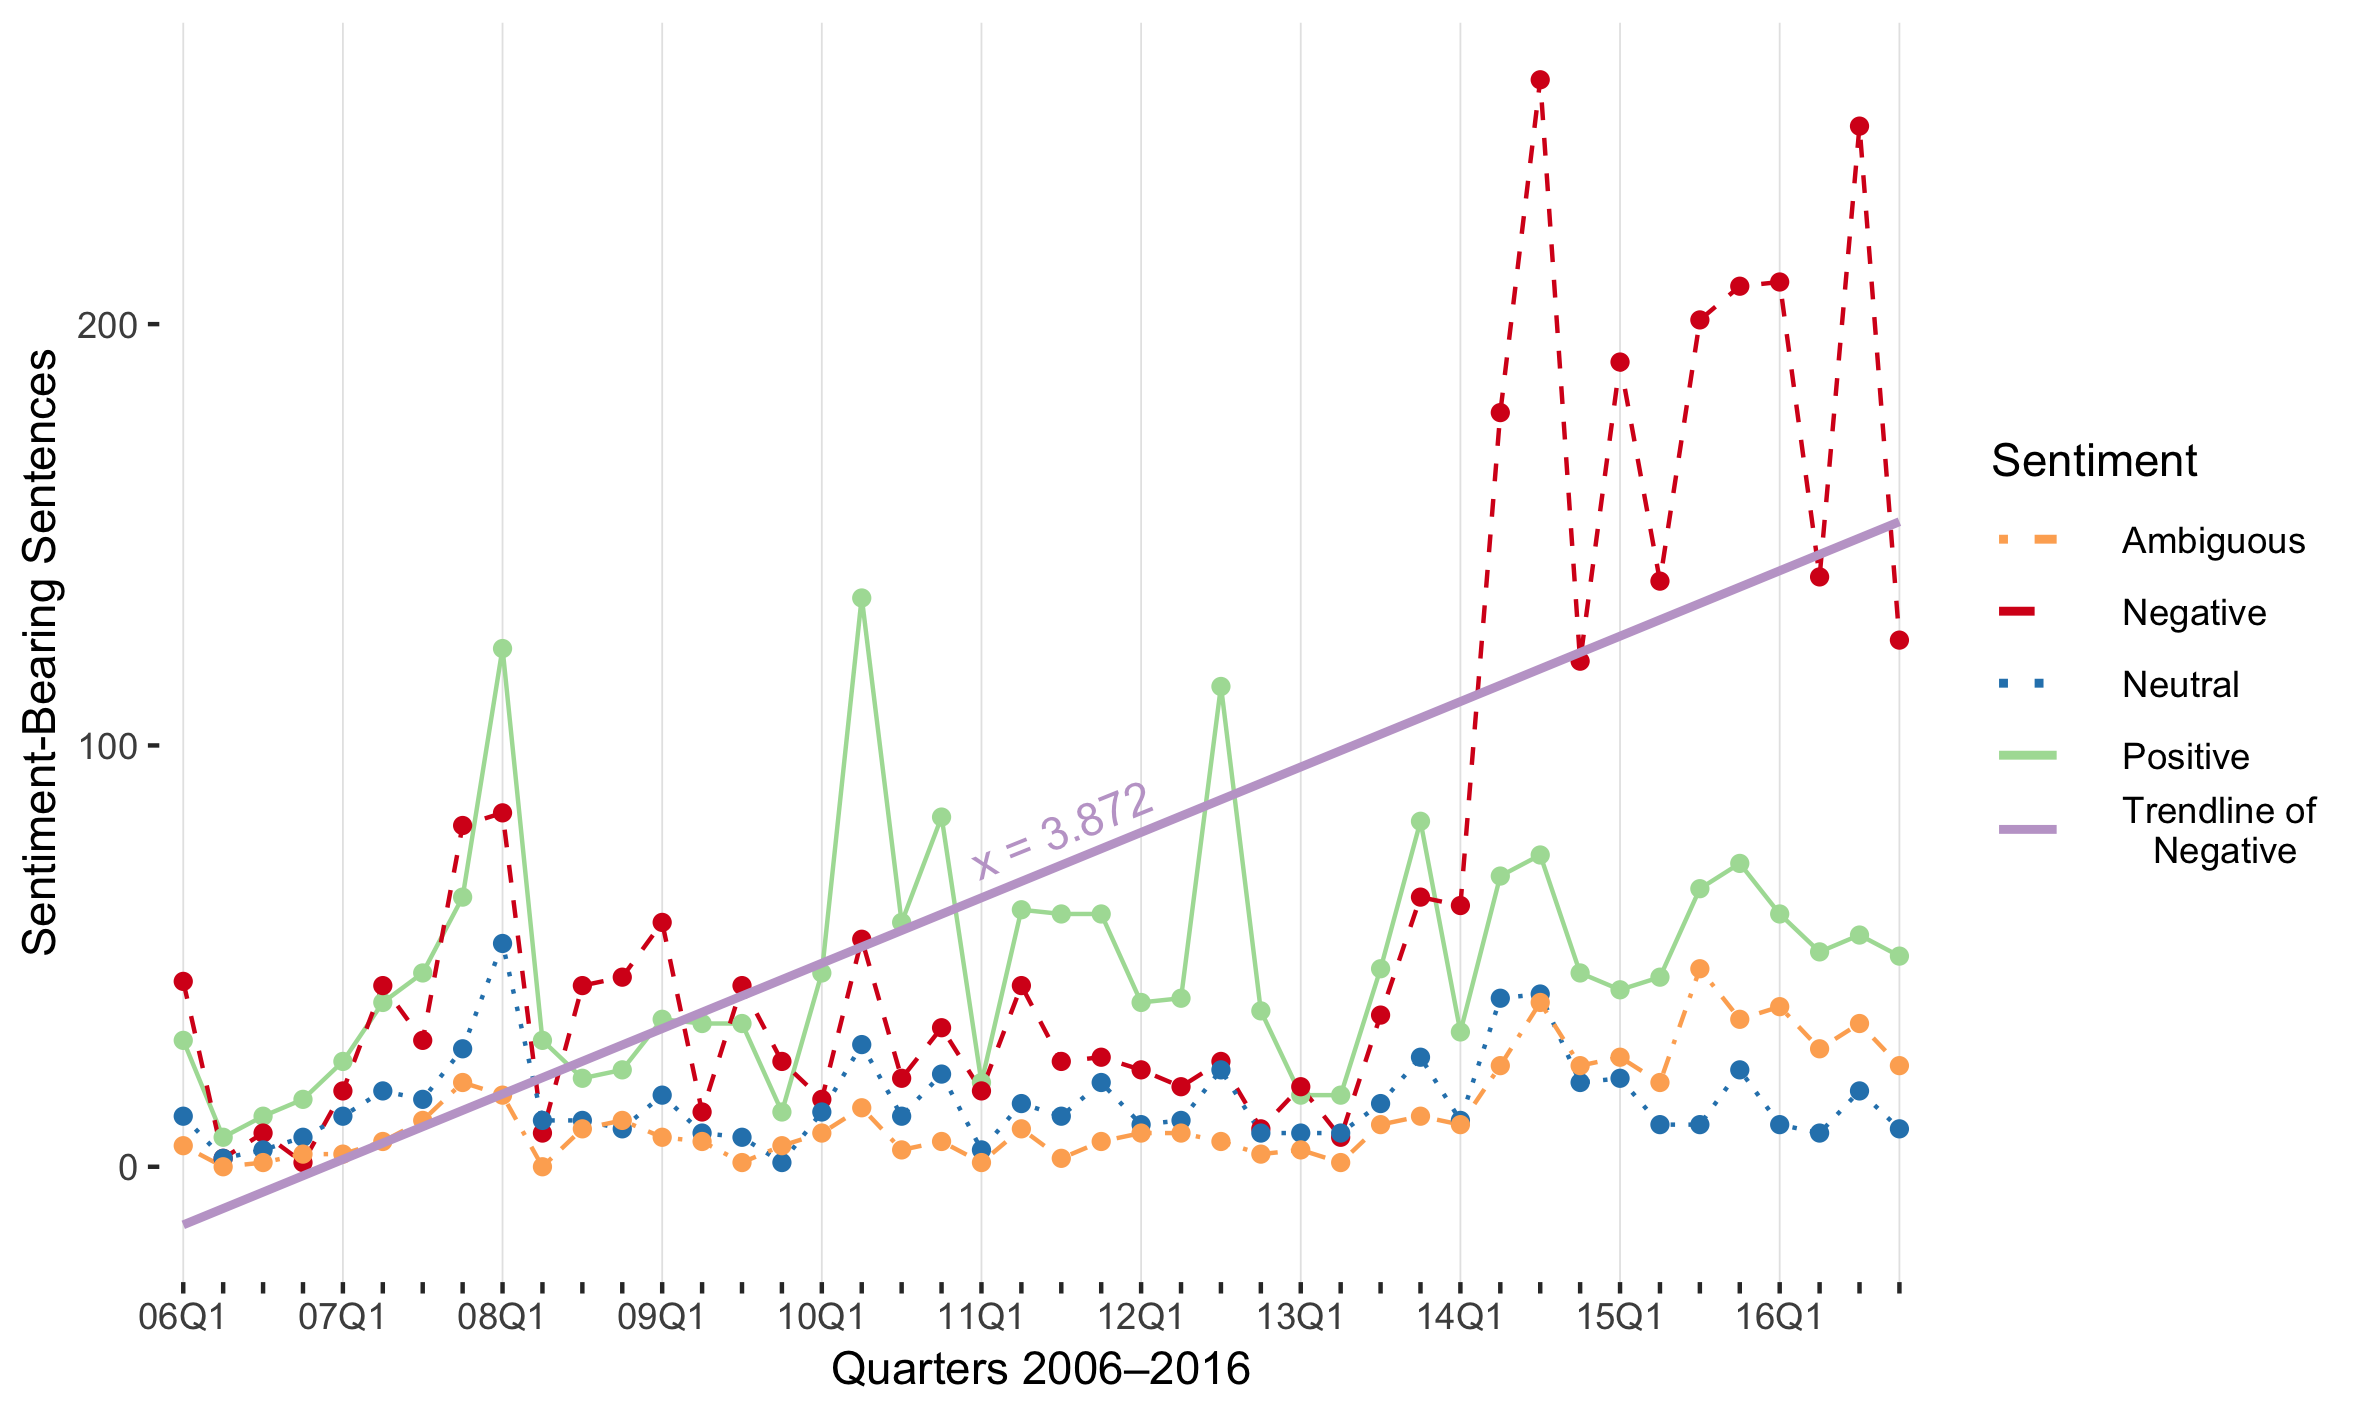
This is Ukrainian top policymakers’ (Prime Ministers and Presidents) sentiment towards Russia from 2006 to 2016:

The x-axis, labelled “Quarters 2006–2016,” presents the analysed corpuse data (from 2006 to 2016) in quarters. A four character tag indicates the year and first quarter. The characters “06Q1,” for example, denotes the first quarter (January, February, March) of 2006. The dashes following this first quarter tag represent a year’s three remaining quarters (April to June, July to September, October to December).
The y-axis, labelled “Sentiment-Bearing Sentences,” tallies the number of sentences categorised by the RUB Code sentiment analysis programs.
The four lines with differnt colours and patterns track the language-bearing sentiments: a green, solid line for positive sentiment; a red, dashed line for negative sentiment; a blue, dotted line for neutral (non-sentiment bearing) language; and an orange, dot-dash line for ambiguous sentiment.
A solid, purple trendline rises across the graph. This is a trendline, which shows the average change (trend) for the single, most prevalent sentiment (either positive or negative). In the image above, the trendline shows a growing negative trend.
Atop the trendline is a marker, “x,” indicating the trendline slope to three decimal places. In the image above, x = “3.872.” This literally means every quarter, on average, Ukrainian policymakers mention Russia negatively in 3.872 separate sentences each quarter.
The list titled “Sentiment” to the right of the line-plot provides a legend of the sentiments and trendline.
In the image, the positive and negative sentiment plots (solid-green and dashed-red respectively) demonstrate differing relations with Russia across three different time periods.
The years in the graph before Yanukovych’s presidency (2006 through 2009), Ukraine’s relations with Russia were mixed. President Viktor Yushchenko (incumbent 2005–2010) had a rocky relationship with Russia for many reasons (Yekelchyk, 2015, p. 97). This is clearly illustrated in the image above by the interchanging positive and negative sentiment plots. In particular, there were disputes over natural gas prices (Wilson, 2015, pp. 338–340). These are visible by jumps in negative sentiment. On 1 January 2006, Russia cut off its gas supply to Ukraine. In figure 6.1, there is a corresponding negative spike Q1 2006. Gas disputes are also depicted by negative spikes in Q4 2007, Q1 2008, and Q1 2009.
In 2010, Viktor Yanukovych’s presidency began, which was reported to be sympathetic to the Kremlin. At once in Q1 2010, the positivity of top policymakers towards Russia shifts dramatically, clearly supporting the claim of a pro-Kremlin slant.
This pro-Kremlin tone maintains itself until Yanukovych’s 2013 manoeuvring between Russia’s Customs Union and the EU’s Association Agreement (Wilson, 2015, p. 348; Makocki & Popescu, 2016, p. 42). This is indicated by the rise in negative sentiment in Q3 and Q4 2013.
Finally, the explosions of negative sentiment during and after Q1 2014 illustrate Russia’s aggressive actions against Ukraine, Yanukovych’s abandonment of Ukraine, and President Poroshenko’s loudly anti-Russia regime taking power. The visualised sentiment analysis results demonstrate all these major changes in bilateral ties.
Russian Policymakers Discussing the EU
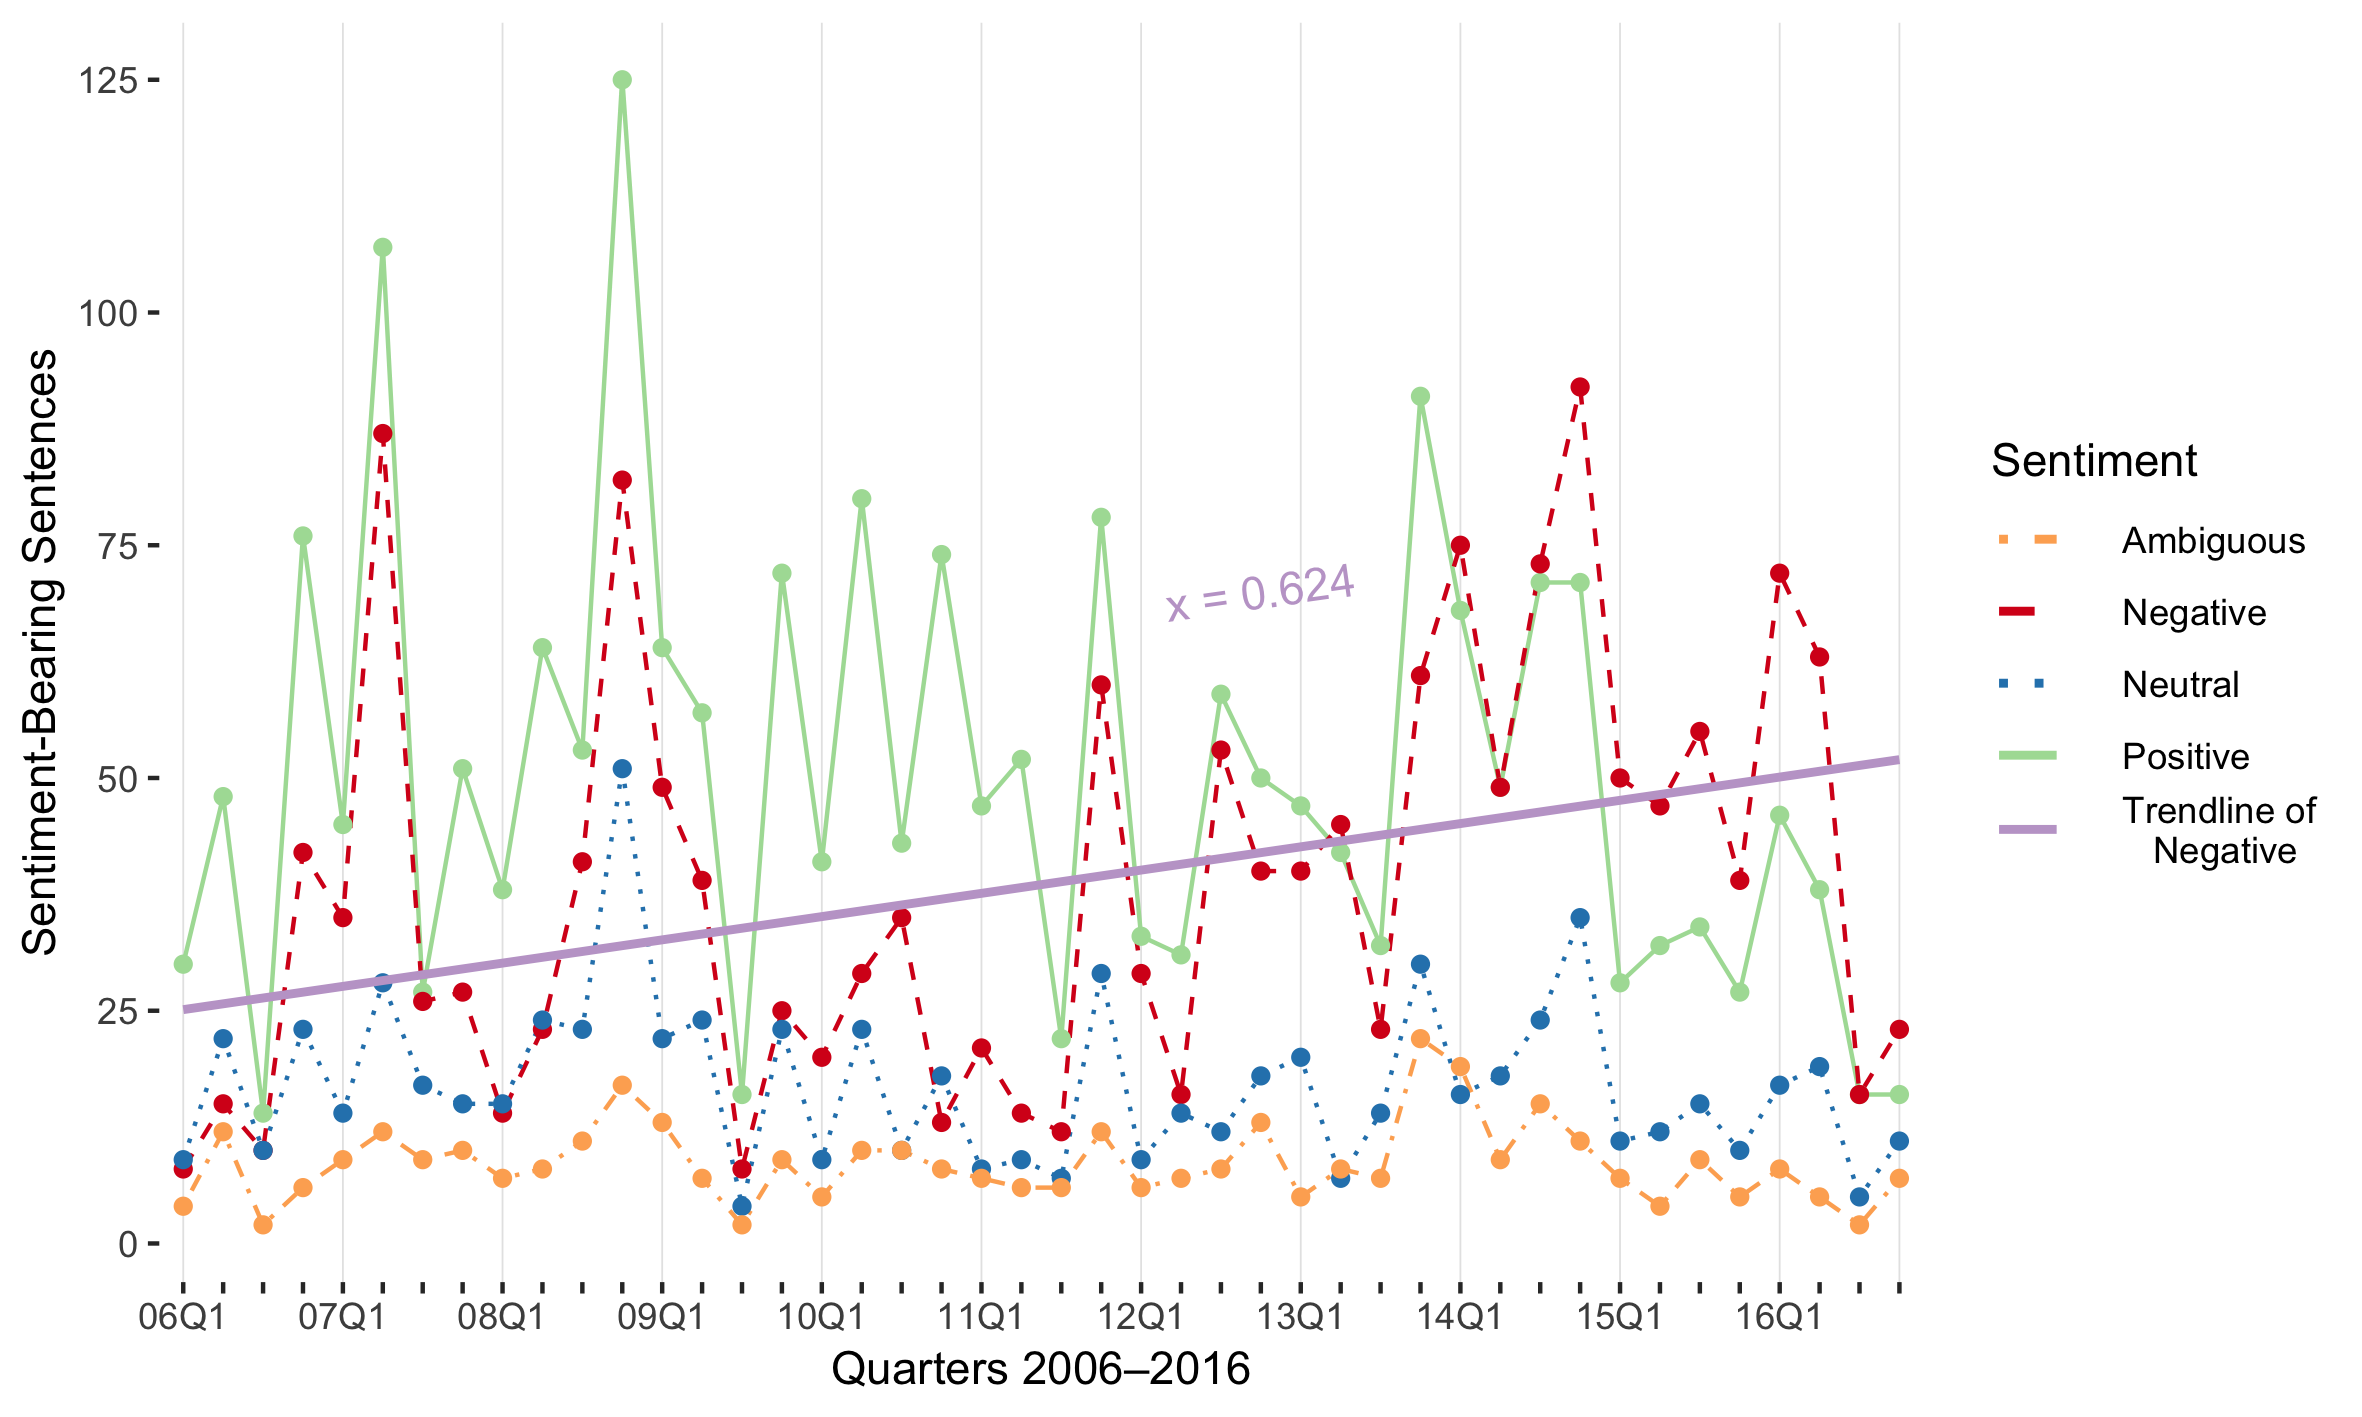
This next visualisation tracks Russian top policymakers’ (Prime Ministers, Presidents, and Foreign Minister) sentiment towards the European Union (EU) from 2006 to 2016:

The graph features, line colours and patterns, and legend represent the same information as the first image in the “RUB Sentiment Analysis” section.
Like in the “RUB Sentiment Analysis” image tracks changes in the Ukraine-Russia relationship, the shifts in positive and negative sentiment also display developments in relations between Russia and the EU.
On 17 March 2014, the EU responded to Russia’s annexation of Crimea by with individual sanctions (consisting of 177 people and 48 entities) (European Council 2020). As the year progressed and Russia-Ukraine relations deteriorated, so were EU sanctions expanded. In the image directly above, Russian policymakers speak of the EU more negatively from the second quarter of 2014 (14Q2).
There are certainly more detailed conclusions to be drawn from this Russian-policymakers-discussing-the-EU image above. But the key take-away is how well the sentiment analysis results function as a visualisation of one country’s bilateral relations towards another country or group of countries.
Policymaker Sentiment on Social Issues
Another use for sentiment analysis is to compare policymakers’ opinion on various societal issues.
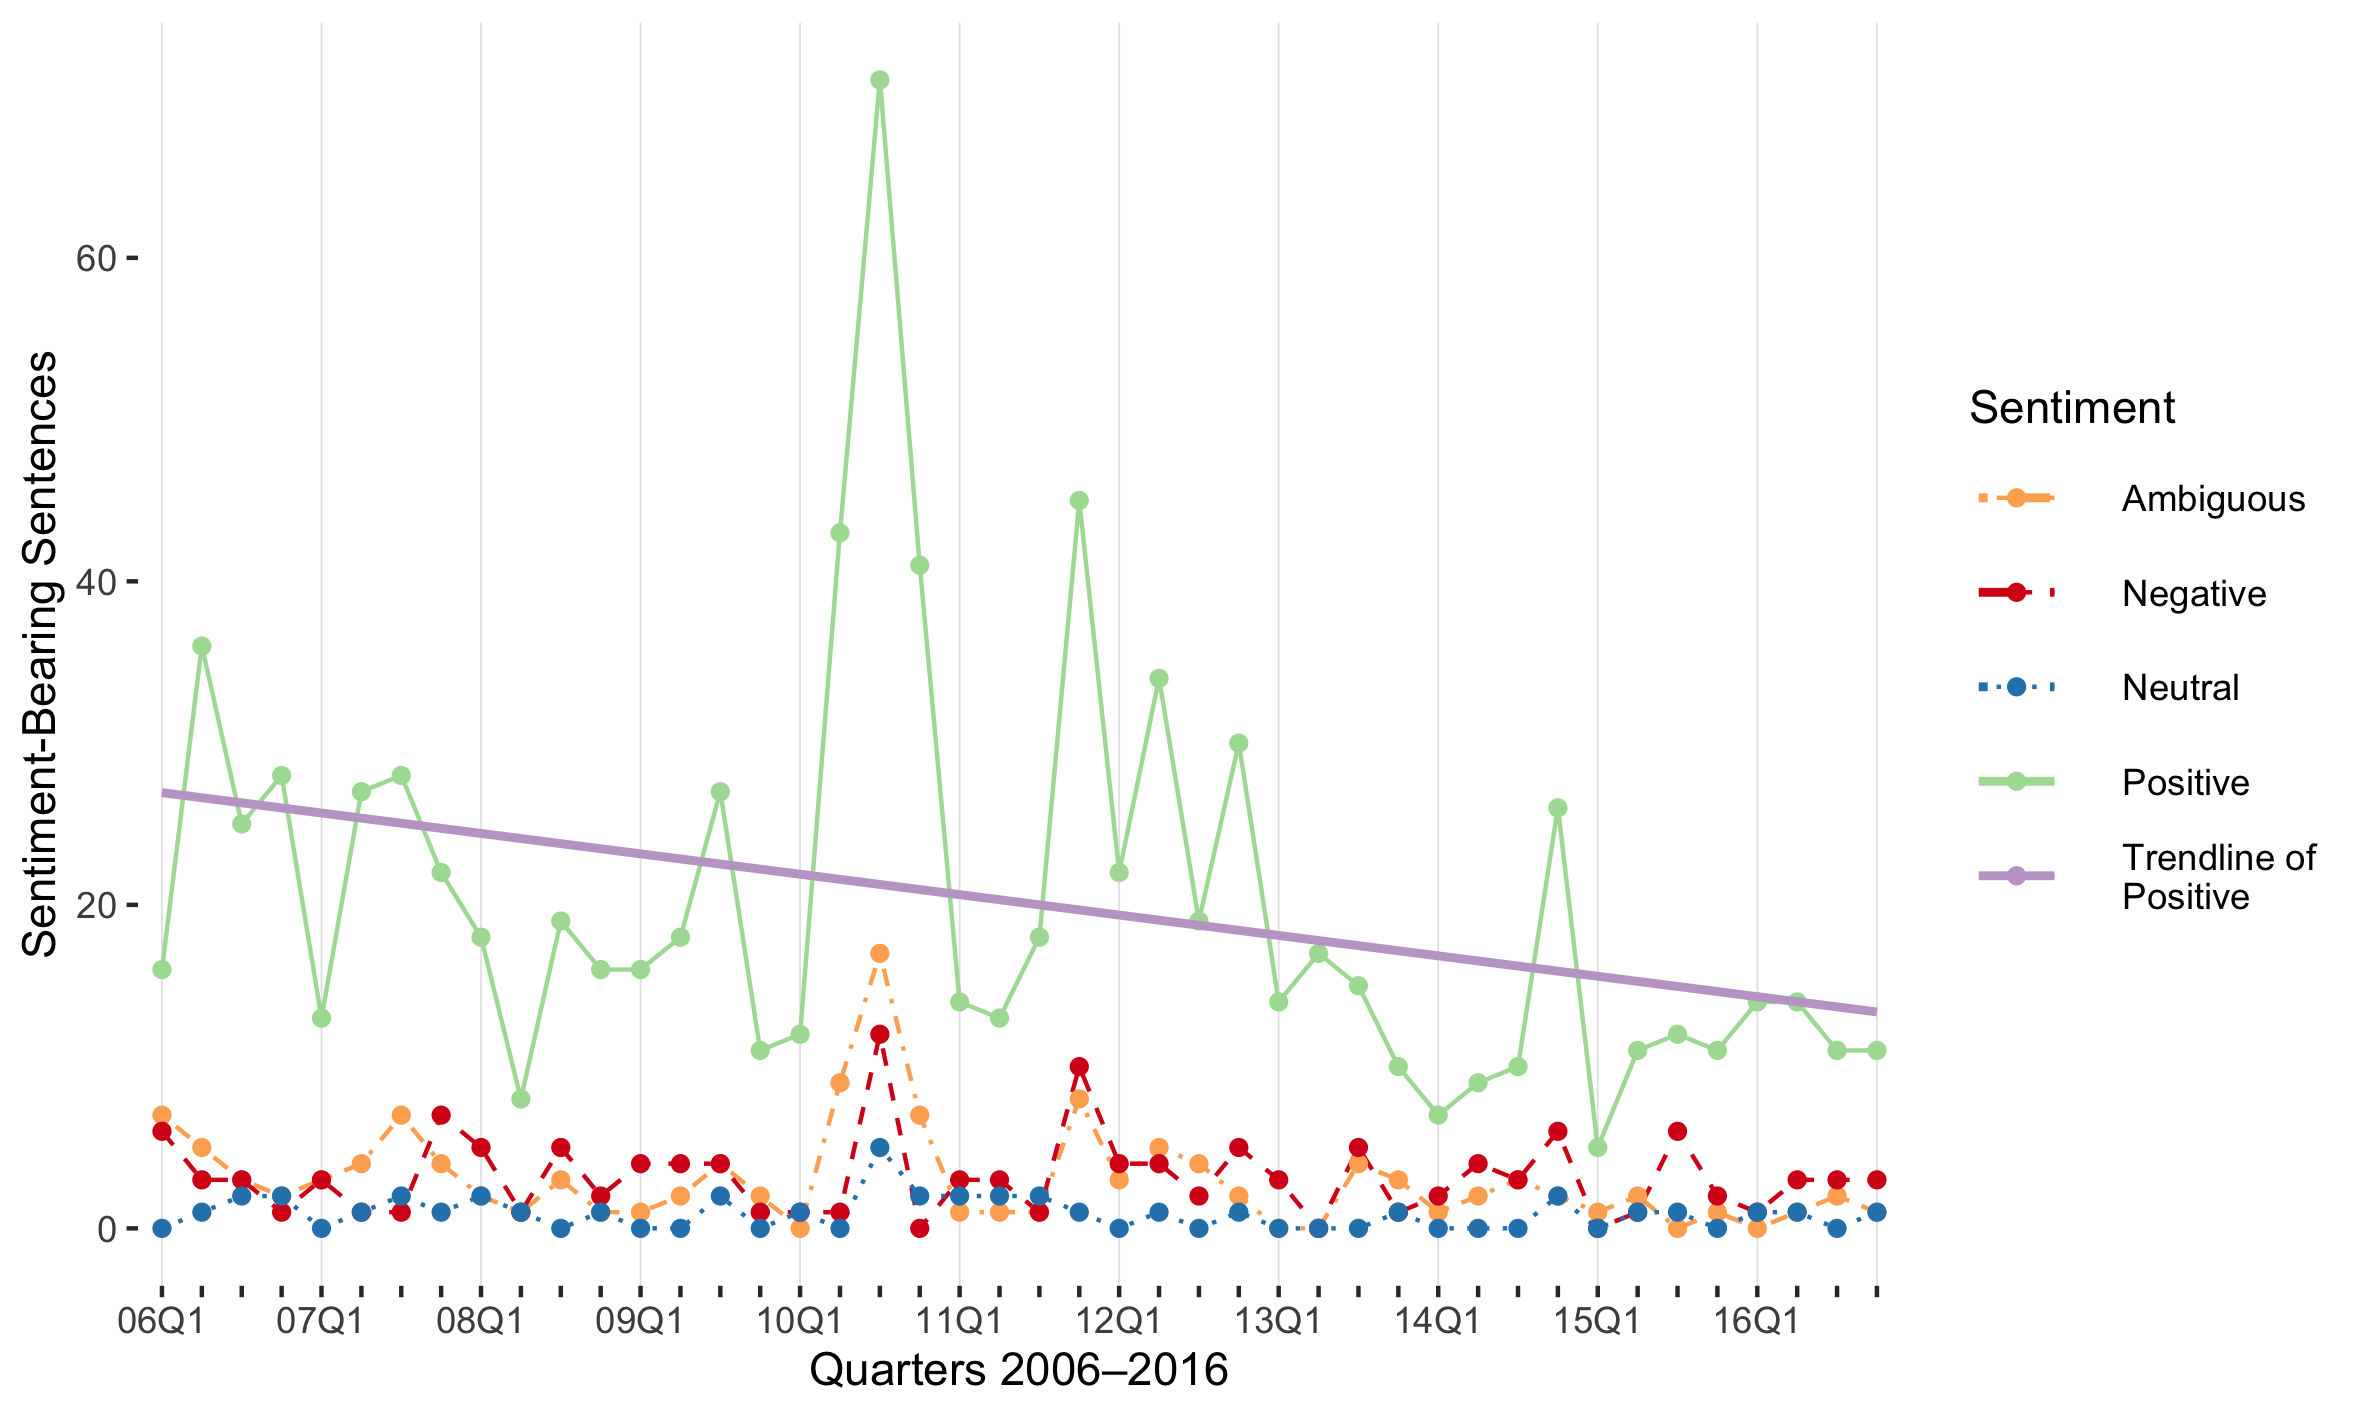
For example, this next image is tracks Russian policymakers’ sentiment towards democracy from 2006 to 2016:

Once more, the graph features and legend represent the same information as the first image in the “RUB Sentiment Analysis” section.
It is clear in this image, top Russian policymakers speak about democracy in positive terms (see the solid green line).
But these policymakers speak about democracy less often over time.
This decline in speaking about democracy is shown by the downward positive sentiment trendline (solid purple), along with a steady reduction in the positive sentiment (solid green) while the remaining sentiment lines remain mostly static.
The positivity spike in Q3 2010 is produced by a conference on contemporary governance, which then Russian President Dmitry Medvedev was an active participant (Kremlin, 2010). This is at the height of Russia’s “virtual thaw” with the West (Gelʹman, 2015, pp. 113–114). During this virtual thaw, Medvedev was the image of a more liberal and, possibly, reformist Russia, while in reality Prime Minister Vladimir Putin and his inner circle maintained or increased their control.
The other noticeable positive spikes in Q4 2011 and Q2 2012 relate to the 2011 legislative elections and the 2012 presidential elections. Vladimir Putin and his United Russia party were alleged to have rigged both elections (Hoyle, 2013).
The declining frequency of “democracy” being mentioned, together with the superficial positive language jumps on each side of Medvedev’s 2008–2012 tenure, fits the argument of Russia’s continued democratic backsliding. This visualised sentiment analysis serves as an empirical measurement for the democratic decline argument.
Summary
These visualisations show just how easily Russian-language sentiment analysis might be applied in other social science disciplines. The Ukraine-Russia and Russia-EU visualisations can be used by international relations specialists. The sentiment analysis visualisation to argue for democratic decline can be useful to political scientists, sociologists, and other researchers.
In addition, the approach used for the RUB Corpus and Code could be refined to track what policymakers have to say on a range of issues, which could be compared with policy developments.
Feel free to contact the author of this project for suggestions of how else to expand and improve this work.
Contact
For issues with the RUB Corpus and Code repositories, please use GitHub.
For general questions about this project or to share any ideas for academic collaboration, feel free to contact Peter Braga at: pjbraga.rubcc@gmail.com.
Page References
European Council. (2020, October 5). EU restrictive measures in response to the crisis in Ukraine [Government website]. Council of the European Union. Available at https://www.consilium.europa.eu/en/policies/sanctions/ukraine-crisis/.
Gelʹman, V. (2015). Authoritarian Russia: Analyzing post-Soviet regime changes. University of Pittsburgh Press.
Hoyle, B. (2013, March 14). President Putin accused of rigging Russian elections. The Times. Available at: https://www.thetimes.co.uk/article/president-putin-accused-of-rigging-russian-elections-0kn9hk7dw59.
The Kremlin. (2010, September 10). “Vystuplenie na plenarnom zasedanii mirovogo politicheskogo foruma "Sovremennoe gosudarstvo: Standarty demokratii i kriterii effektivnosti’” [Speech at the plenary session of the international political forum, ‘The Modern State: Standards of Democracy and Criteria of Effectiveness’] [Government website]. President of Russia. Available at: ttp://kremlin.ru/events/president/transcripts/8887.
Makocki, M., & Popescu, N. (2016). China and Russia: An Eastern partnership in the making? European Union Institute for Security Studies. http://publications.europa.eu/resource/cellar/f110f67b-0305-11e7-8a35-01aa75ed71a1.0001.03/DOC_2.
R Core Team. (2020). R: A language and environment for statistical computing. R Foundation for Statistical Computing. https://www.R-project.org/.
Wilson, A. (2015). The Ukrainians: Unexpected Nation (Fourth edition). Yale University Press. Available at: https://yalebooks.co.uk/display.asp?k=9780300217254.
Yekelchyk, S. (2015). The conflict in Ukraine: What everyone needs to know. Oxford University Press.https://global.oup.com/ushe/product/the-conflict-in-ukraine-9780190237288?cc=gb&lang=en&.